2005 Problems
Problem A
Problem: Modeling Ocean Bottom Topography
Background:
A marine survey ship maps ocean depth by using sonar to reflect a sound pulse off the ocean floor. Figure A shows the ship’s location at B on the surface of the ocean. The sonar apparatus aboard the ship is capable of emitting sound pulses in an arc measuring from 2 to 30 degrees. In two dimensions this arc is shown within Figure A by  , and the emanating sound pulses are displayed by the dashed lines and the solid lines BA and BC. , and the emanating sound pulses are displayed by the dashed lines and the solid lines BA and BC.
When a sonar sound pulse hits the bottom of the ocean, the pulse is reflected off the ocean bottom the same way a billiard ball is reflected off a pool table; that is, the angle of incidence  equals the angle of reflection equals the angle of reflection  as illustrated in Figure B. Since the ship is moving when the sound pulse is emitted, it will pick up a reflected sound pulse at location F in this picture. The actual depth of the water is the length of BD in Figure A as illustrated in Figure B. Since the ship is moving when the sound pulse is emitted, it will pick up a reflected sound pulse at location F in this picture. The actual depth of the water is the length of BD in Figure A
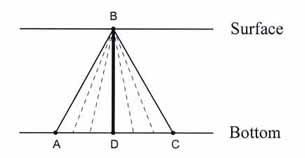
Figure A
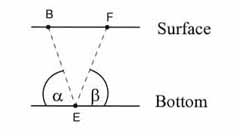
Figure B
Useful Information:
Oceanography vessels usually travel at a speed of 2m/s while Navy vessels travel at 20m/s. The sonar apparatus aboard these ships is capable of emitting sound pulses in an arc measuring from 2 to 30 degrees. The typical speed at which a sonar sound pulse is emitted is 1500m/s.
Devise a model for mapping the topography of the ocean bottom. Write a letter to the science editor of your local paper summarizing your findings.
Problem B
Problem: Gas Prices, Inventory, National Disasters, and the Mighty Dollar
It appears from the economic reports that the world uses gasoline on a very short supply and demand scale. The impact of any storm, let alone Hurricane Katrina, affects the costs at the pumps too quickly. Let’s restrict our study to the continental United States.
Over the past six years, Canada has been the leading foreign supplier of oil to the United States, including both crude and refined oil products. (Petroleum Supply Monthly, Table S3 - Crude Oil and Petroleum Product Imports, 1988-Present. See page 5 for Canadian exports to the United States.)
- Canada was the largest foreign supplier of oil to the United States again in 2004, for the sixth year running (from 1999, when the country displaced Venezuela, to 2004 inclusive).
- In 2002, Canada supplied the United States with 17 percent of its crude and refined oil imports — more than any other foreign supplier at over 1.9 million barrels per day.
- Western Canadian crude oil is imported principally by the U.S. Midwest and the Rocky Mountain states.
- Eastern Canada's offshore oil is imported principally by the U.S. East Coast states, and even by some Gulf Coast states.
Many refiners are buying enough to serve motorists' current needs, but not enough to rebuild stocks. "They are looking to buy the oil when they need it,” according to The Washington Post. "When they are uncertain about the future, they hold back." (The Washington Post: Crude Oil Imports to U.S. Slow With War 3/31/03.)
Build a better model for the oil industry for its use and consumption in the United States that is fair to both the business and the consumer. You can build your model based on a peak day.
Write a letter to the President’s energy advisor summarizing your findings.
|