2015 Problems
Problem A
Problem: Preventing Road Rage
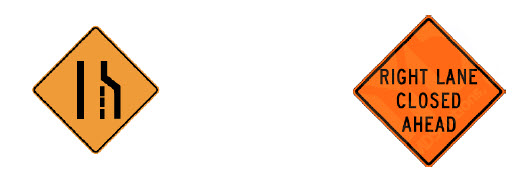
Have you ever been traveling down a highway when you see one or both of these signs?
In some cases, the road simply loses a lane as it enters a less traveled section. In other cases, the road narrows because of construction or roadwork. When this happens on a fairly busy highway, it may be a recipe for road rage*.
Assume we're on a busy two-lane road reducing to a one-lane road. Once a driver sees a sign indicating the right lane is going to end, he or she has a choice: drive in the right lane or drive in the left lane. Often, many drivers move into the left lane fairly quickly. This causes the left lane to become congested and slow down. Some drivers remain in the right lane and are able to maintain their speed (and pass the vehicles in the left lane which are now moving slower).
When a lane closure is approaching, there will be signs indicating the distance of the lane closure as it nears (e.g. 1 mile, 1/2 mile, 500 ft.). As the end of the right lane approaches, some of the right lane drivers merge into the left lane, while others continue heading toward the lane closure. It's at this point that the probability of road rage rapidly increases. Horns blast and gestures are made. Some cars will pull half way into the right lane in an attempt to prevent any cars from passing only to have another vehicle swerve around them and continue toward the lane closure point. At times, a vehicle will stay in the right lane directly next to, and driving at the same speed as, a chosen vehicle in the left lane in an effort to make the travel toward the lane closure "fair."
Some states have done research on this phenomenon, but there is no consensus around best practices. Your team is tasked to provide a fresh analysis of this issue or add value to any existing analysis. Teams should not simply mimic previous research.
Part I: Analyze the various driver actions and their implications in lane closure situations on a major highway.
Part II: From your analysis in Part I, address and support fair and efficient driver actions:
a) In the case of two lanes merging to one, what is the "fairest" way for drivers to behave as they approach a lane closure? What is the most "efficient" way for drivers to behave as they approach a lane closure? Is there a difference between "fair" and "efficient?"
b) Use your analysis to address and support what drivers should do if a three-lane highway is reducing to two lanes? How should driver behavior change, if at all, if the three-lane highway is reducing to one lane?
c) Discuss and support any differences in fair and efficient driver behavior for lane closures on a secondary road with a 35 mile per hour speed limit versus a highway with a 65 mile per hour speed limit.
Part III: Policies and Practices
a) From your analysis in Parts I and II, develop guidelines for inclusion in the Department of Motor Vehicles driver education materials and signage used by the Department of Highway Safety to encourage appropriate driver actions when approaching a lane closure.
b) In addition to the HiMCM contest format, write a one-page cover letter in support of your guidelines and signage to the Director of the Department of Transportation, urging adoption of your recommendations.
*Road rage is aggressive or angry behavior by a driver of an automobile or other road vehicle. Such behavior might include rude gestures, verbal insults, deliberately driving in an unsafe or threatening manner, or making threats. Road rage can lead to altercations, assaults, and collisions that result in injuries and even deaths. It can be thought of as an extreme case of aggressive driving. (http://en.wikipedia.org/wiki/Road_rage)
Problem B
Problem: City Crime and Safety
What can we make of the massive amount of crime statistics collected in major cities? Beyond just reporting numbers, how can we use these data to determine the safeness of a city?
Assume that you and your modeling team live in My City, a large international hub of commerce, technology, finance and travel, with a current population of 2.8 million people impacted by a metropolitan area of an additional approximately 6 million people.
The data set provided (My_City_Crime_Data.xlsx) shows two weeks from police reports in My City and includes crimes listed by case number, date of occurrence, primary and secondary crime descriptions, crime location, whether an arrest was made, whether or not this was domestic crime, and the beat number of the police route.
Part I: Using mathematical modeling, analyze the data. Create a safety rating for My City. Use your safety rating to specify a measure of how safe My City is.
Part II: In addition to the HiMCM contest format, prepare a 1-2 page non-technical report for the Mayor of My City to describe your findings.
|

